Category: obiee

  • Khóa học miễn phí OBIEE – Testing Repository nhận dự án làm có lương

    OBIEE – Testing Repository


    You can check the repository for errors by using the consistency checking option. Once it is done, next step is to load the repository into Oracle BI Server. Then test the repository by running an Oracle BI analysis and verifying the results.

    Go to File → click on Check Global Consistency → You will receive the following message → Click Yes.

    Testing Repository

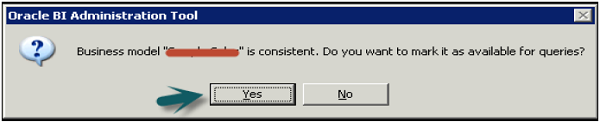
    Once you click OK → Business model under BMM will change to Green → Click on save the repository without checking global consistency again.

    Disable Caching

    To improve query performance, it is advised to disable BI server cache option.

    Open a browser and enter the following URL to open Fusion Middleware Control Enterprise Manager: http://<machine name>:7001/em

    Enter the user name and password. Click Login.

    On the left side, expand Business Intelligence → coreapplication → Capacity Management tab → Performance.

    Testing Repository Disable Caching

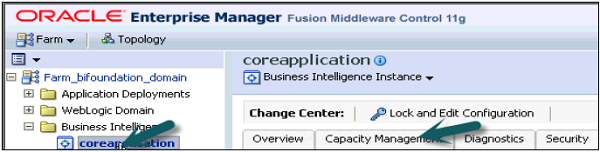
    Enable BI Server Cache section is by default checked → Click on Lock and Edit Configuration → Close.

    Testing Repository Enable BI Server

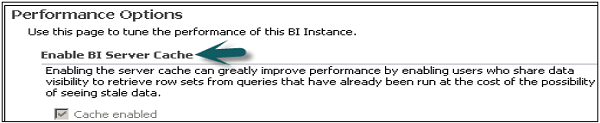
    Now deselect cache enabled option. It is used to improve query performance. Go to Apply → Activate Changes → Completed Successfully.

    Load the Repository

    Go to Deployment tab → Repository → Lock and Edit Configuration → Completed Successfully.

    Load Testing Repository

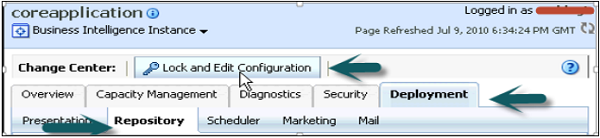
    Click on Upload BI Server Repository section → Browse to open the Choose file dialog box → select the Repository .rpd file and click Open → Enter Repository password → Apply → Activate Changes.

    Upload BI Server Repository

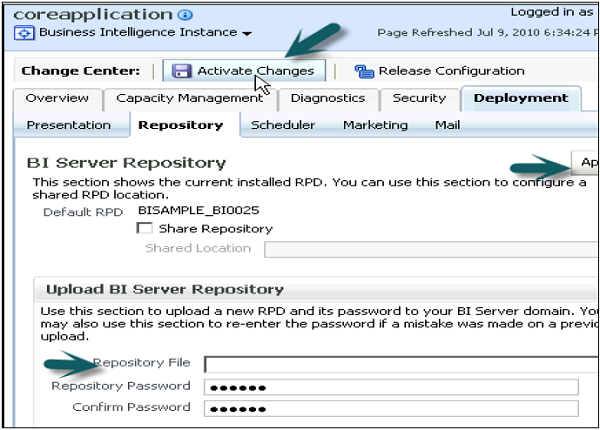
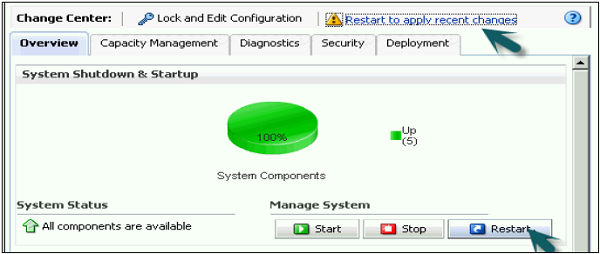
    Activate Changes → Completed Successfully → Click on Restart to apply recent changes option at the top → Click Yes.

    Testing Repository Completed Successfully

    Repository is successfully created and loaded for query analysis.

    Enable Query Logging

    You can set up query logging level for individual users in OBIEE. Logging level controls the information that you will retrieve in log file.

    Set Up Query Logging

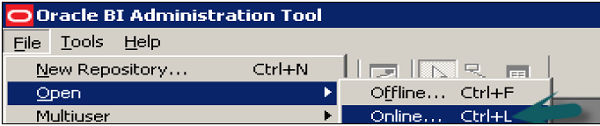
    Open the Administration tool → Go to File → Open → Online.

    Online mode is used to edit the repository in Oracle BI server. To open a repository in online mode, your Oracle BI server should be running.

    Set Up Query Logging

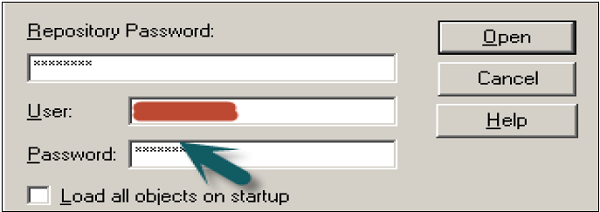
    Enter the Repository password and user name password to login and click Open to open the repository.

    Repository Password

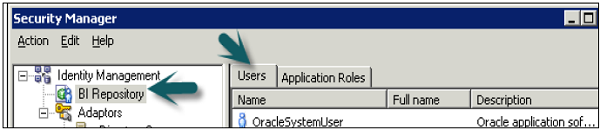
    Go to Manage → Identity → Security Manager Window will open. Click BI Repository on the left side and double-click on Administrative user → User dialogue box will open.

    Security Manager

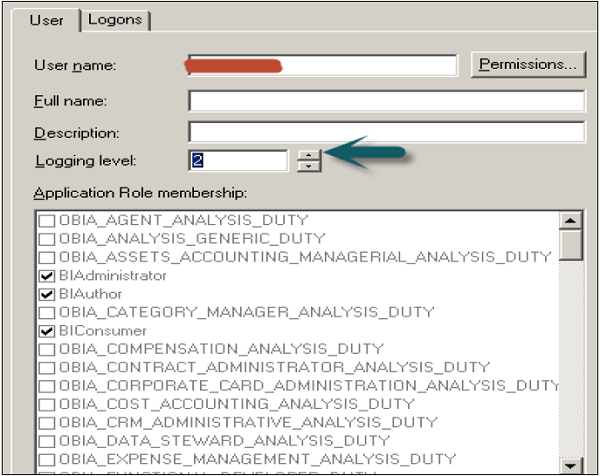
    Click User tab in user dialogue box, you can set logging levels here.

    In normal scenario − The user has a logging level set to 0 and the administrator has a logging level set to 2. Logging level can have values starting from Level 0 to level 5. Level 0 means no logging and Level 5 means maximum logging level information.

    Logging Level Descriptions

    Level 0 No logging
    Level 1

    Logs the SQL statement issued from the client application

    Logs elapsed times for query compilation, query execution, query cache processing, and back-end database processing

    Logs the query status (success, failure, termination, or timeout). Logs the users ID, session ID, and request ID for each query

    Level 2

    Logs everything logged in Level 1

    Additionally, for each query, logs the repository name, business model name, presentation catalog (called Subject Area in Answer) name, SQL for the queries issued against physical databases, queries issued against the cache, number of rows returned from each query against a physical database and from queries issued against the cache, and the number of rows returned to the client application

    Level 3

    Logs everything logged in Level 2

    Additionally, adds a log entry for the logical query plan, when a query that was supposed to seed the cache was not inserted into the cache, when existing cache entries are purged to make room for the current query, and when the attempt to udate the exact match hit detector fails

    Level 4

    Logs everything logged in Level 3

    Additionally, logs the query execution plan.

    Level 5

    Logs everything logged in Level 4

    Additionally, logs intermediate row counts at various points in the execution plan.

    To Set Logging Level

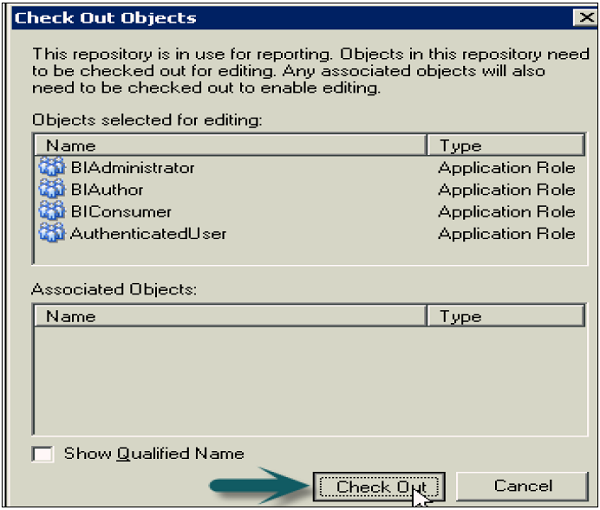
    In user dialogue box, enter value for logging level.

    Set Logging Level

    Once you click OK, it will open the checkout dialogue box. Click Checkout. Close the Security Manager.

    Check Out Objects

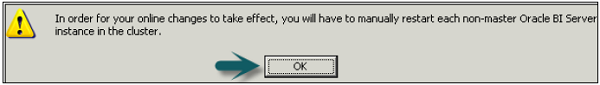
    Go to file → Click on check-in changes → Save the repository using the Save option at the top → To take changes in effect → Click OK.

    Check in Changes

    Use Query Log to Verify Queries

    You can check query logs once query logging level is set by going to Oracle Enterprise Manager and this helps to verify queries.

    To check the query logs to verify queries, go to Oracle Enterprise Manager OEM.

    Go to diagnostic tab → click Log messages.

    Verify Queries Using Query Log

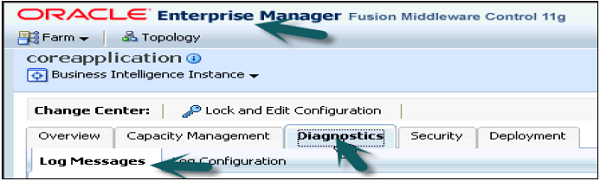
    Scroll down to bottom in log messages to see Server, Scheduler, Action Services and other log details. Click on Server log to open log messages box.

    You can select various filters − Date Range, Message types and message contains/not contains fields, etc. as shown in the following snapshot −

    Log Messages

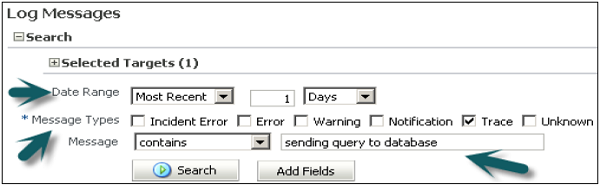
    Once you click on search, it will show log messages as per filters.

    Filter Log Messages

    Clicking on collapse button allows you to check details of all log messages for queries.


    Khóa học lập trình tại Toidayhoc vừa học vừa làm dự án vừa nhận lương: Khóa học lập trình nhận lương tại trung tâm Toidayhoc

  • Khóa học miễn phí OBIEE – Questions Answers nhận dự án làm có lương

    OBIEE Questions and Answers


    OBIEE Questions and Answers has been designed with a special intention of helping students and professionals preparing for various Certification Exams and Job Interviews. This section provides a useful collection of sample Interview Questions and Multiple Choice Questions (MCQs) and their answers with appropriate explanations.

    Questions and Answers
    SN Question/Answers Type
    1

    This section provides a huge collection of OBIEE Interview Questions with their answers hidden in a box to challenge you to have a go at them before discovering the correct answer.

    2

    This section provides a great collection of OBIEE Multiple Choice Questions (MCQs) on a single page along with their correct answers and explanation. If you select the right option, it turns green; else red.

    3

    If you are preparing to appear for a Java and OBIEE related certification exam, then this section is a must for you. This section simulates a real online test along with a given timer which challenges you to complete the test within a given time-frame. Finally you can check your overall test score and how you fared among millions of other candidates who attended this online test.

    4

    This section provides various mock tests that you can download at your local machine and solve offline. Every mock test is supplied with a mock test key to let you verify the final score and grade yourself.


    Khóa học lập trình tại Toidayhoc vừa học vừa làm dự án vừa nhận lương: Khóa học lập trình nhận lương tại trung tâm Toidayhoc

  • Khóa học miễn phí OBIEE – Level-Based Measures nhận dự án làm có lương

    OBIEE – Level-Based Measures


    Level-based measures are created to perform calculation at a specific level of aggregation. They allow to return data at multiple levels of aggregation with one single query. It also allows to create share measures.

    Example

    Let us say there is a company XYZ Electronics which sells its products in many regions, countries and cities. Now the company President wants to see the total revenue at country level – one level below region and one level above cities. So total revenue measure should be summed up to the country level.

    These type of measures are called level-based measures. Similarly, you can apply level-based measures on the time hierarchies.

    Once the dimension hierarchies are created, level-based measures can be created by double clicking on the total revenue column in the logical table and setting the level in the levels tab.

    Create Level-Based Measures

    Open the repository in offline mode. Go to File → Open → Offline.

    Select .rpd file and click open → Enter repository password and click Ok.

    In BMM layer, right-click on Total Revenue column → New Object → Logical column.

    Create Level-Based Measures

    It will open the logical column dialog box. Enter the name of logical column total revenue. Go to column source tab → Check derived from existing columns using an expression.

    Logical Column Dialog Box

    Once you select this option, expression edit wizard will be highlighted. In expression builder wizard, select the logical table → Column name → Total revenue from the left side menu → Click OK.

    Now go to level tab in logical column dialog box → Click on logical dimension to select it as grand total under logical level. This specifies that the measure should be calculated at grand total level in the dimension hierarchy.

    Grand Total Level

    Once you click OK → Total Revenue logical table will appear under the logical dimension and Fact tables.

    This column can be dragged to presentation layer in the subject area to be used by end users to generate reports. You can drag this column from fact tables or from logical dimension.


    Khóa học lập trình tại Toidayhoc vừa học vừa làm dự án vừa nhận lương: Khóa học lập trình nhận lương tại trung tâm Toidayhoc

  • Khóa học miễn phí OBIEE – Multiple Logical Table nhận dự án làm có lương

    OBIEE – Multiple Logical Table Sources


    When you drag and drop a column from a physical table that is not currently being used in your logical table in BMM layer, the physical table containing such column gets added as a new Logical Table Source (LTS).

    When in BMM layer, you use more than one table as source table, it is called multiple logical table sources. You can have a Fact table as multiple logical table sources when it uses different physical tables as source.

    Example

    Multiple LTS are used to convert Snowflakes schema to Star schemas in BMM layer.

    Let us say you have two dimensions − Dim_Emp and Dim_Dept and one fact table FCT_Attendance in the Physical layer.

    Here your Dim_Emp is normalized to Dim_Dept to implement Snowflakes schema. So in your Physical diagram, it would be like this −

    Dim_Dept<------Dim_Emp <-------FCT_Attendance
    

    When we move these table to the BMM layer, we will create a single dimension table Dim_Employee with 2 logical sources corresponding to Dim_Emp and Dim_Dept. In your BMM diagram −

    Dim_Employee <-----------FCT_Attendance
    

    This is one approach where you can use concept of multiple LTS in BMM layer.

    Specifying Content

    When you use multiple physical tables as sources, you expand table sources in BMM diagram. It shows all multiple LTS from where it is picking up the data in BMM layer.

    To see table mapping in BMM layer, expand the sources under logical table in BMM layer. It will open Logical table source mapping dialogue box. You can check all tables which are mapped to provide data in logical table.

    Specifying Content

    Khóa học lập trình tại Toidayhoc vừa học vừa làm dự án vừa nhận lương: Khóa học lập trình nhận lương tại trung tâm Toidayhoc

  • Khóa học miễn phí OBIEE – Dimension Hierarchies nhận dự án làm có lương

    OBIEE – Dimension Hierarchies


    Hierarchies is a series of many-to-one relationships and can be of different levels. A Region hierarchy consists of: Region → Country → State → City → Street. Hierarchies follow top-down or bottom-up approach.

    Logical dimensions or dimension hierarchies are created in BMM layer. There are two types of dimensional hierarchies that are possible −

    • Dimensions with level-based hierarchies.
    • Dimension with Parent-Child hierarchies.

    In level-based hierarchies, members can be of different types and members of the same type come only at single level.

    In Parent-Child hierarchies, all members are of the same type.

    Dimensions with Level-based Hierarchies

    Level-based dimension hierarchies can also contain parent-child relationships. The common sequence to create level-based hierarchies is to start with grand total level and then working down to lower levels.

    Level-based hierarchies allows you to perform −

    • Level-based calculated measures.
    • Aggregate navigation.
    • Drill down to child level in dashboards.

    Each dimension can only have one grand total level and it doesn’t have a level key or dimension attributes. You can associate measures with grand total level and default aggregation for these measures are grand total always.

    All lower levels should have at least one column and each dimension contains one or more hierarchies. Each lower level also contains a level key which defines unique value at that level.

    Types of Level-based Hierarchies

    Unbalanced Hierarchies

    Unbalanced hierarchies are those where all the lower levels don’t have the same depth.

    Example − For one product, for one month you can have data for weeks and for other month you can have data available for day level.

    Skip Level Hierarchies

    In skip-level hierarchies, few members don’t have values at higher level.

    Example − For one city, you have state → country → Region. However for other city, you have only state and it doesn’t fall under any country or region.

    Dimension with Parent-child Hierarchies

    In parent-child hierarchy, all the members are of the same type. The most common example of parent-child hierarchy is the reporting structure in an organization. Parent-child hierarchy is based on a single logical table. Each row contains two keys – one for the member and another for the parent of the member.


    Khóa học lập trình tại Toidayhoc vừa học vừa làm dự án vừa nhận lương: Khóa học lập trình nhận lương tại trung tâm Toidayhoc

  • Khóa học miễn phí OBIEE – Aggregates nhận dự án làm có lương

    OBIEE – Aggregates


    Aggregations are used to implement query performance optimization while running the reports. This eliminates the time taken by query to run the calculations and delivers the results at fast speed. Aggregate tables has less number of rows as compared to a normal table.

    How Aggregation Works in OBIEE?

    When you execute a query in OBIEE, BI server looks for the resources which has information to answer the query. Out of all available sources, the server selects the most aggregated source to answer that query.

    Adding Aggregation in a Repository

    Open the Repository in an offline mode in the Administrator tool. Go to File → Open → Offline.

    Import the metadata and create logical table source in BMM layer. Expand the table name and click on source table name to open logical table source dialog box.

    Go to column mapping tab to see map columns in Physical table. Go to content tab → Aggregate content group by selecting the logical level.

    Adding Aggregation in Repository

    You can select different logical levels as per the columns in fact tables like Product Total, Total Revenue, and Quarter/Year for Time as per dimension hierarchies.

    Select Different Logical Levels

    Click OK to close dialog box → save the repository.

    When you define Aggregate in logical fact tables they are defined as per dimension hierarchies.


    Khóa học lập trình tại Toidayhoc vừa học vừa làm dự án vừa nhận lương: Khóa học lập trình nhận lương tại trung tâm Toidayhoc

  • Khóa học miễn phí OBIEE – Calculation Measures nhận dự án làm có lương

    OBIEE – Calculation Measures


    Calculated measures is used to perform calculation of facts in logical tables. It defines Aggregation functions in Aggregation tab of logical column in the repository.

    Create New Measure

    Measures are defined in logical fact tables in repository. Any column with an aggregation function applied on it is called a measure.

    Common measure examples are − Unit Price, quantity sold, etc.

    Following are the guidelines to create measures in OBIEE −

    • All aggregation should be performed from a fact logical table and not from a dimension logical table.

    • All columns that cannot be aggregated should be expressed in a dimension logical table and not in a fact logical table.

    Calculated measures can be defined in two ways in logical tables at BMM layer in Administration tool −

    • Aggregations in logical tables.
    • Aggregations in logical table source.

    Create Calculated Measures in Logical Tables using Administration Tool

    Double-click on the column name in the logical Fact table, you will see the following dialog box.

    Logical Fact Table

    Go to Aggregation tab and select the Aggregate function from the drop-down list → Click OK.

    Aggregation Function

    You can add new measures using functions in Expression builder wizard in Column source. Measures represent data that is additive, such as total revenue or total quantity. Click on the save option at the top to save the repository. This is also called creating measures at logical level.

    Create Calculated Measures in Logical Table Source using Administration Tool

    You can define Aggregations by a double-click on Logical table source to open logical table dialogue box.

    Logical Table Source Using Administration Tool

    Click on Expression builder wizard to define expression.

    In Expression builder, you can choose multiple options like – Category, functions, and mathematical functions.

    Once you select the category, it will show the subcategories inside it. Select the subcategory and mathematical function, and click on the arrow mark to insert it.

    Expression Builder

    Now to edit the value to create measures, click on source number, enter the calculated value like multiple and divide → Go to Category and select logical table → Select column to apply this multiple/division to an existing column value.

    Logical Table Category

    Click OK to close the Expression builder. Again click OK to close the dialog box.


    Khóa học lập trình tại Toidayhoc vừa học vừa làm dự án vừa nhận lương: Khóa học lập trình nhận lương tại trung tâm Toidayhoc

  • Khóa học miễn phí OBIEE – Home nhận dự án làm có lương

    OBIEE Tutorial

    OBIEE Tutorial


    Oracle Business Intelligence Enterprise Edition (OBIEE) is a Business Intelligence (BI) tool by Oracle Corporation. Its proven architecture and common infrastructure producing and delivering enterprise reports, scorecards, dashboards, ad-hoc analysis, and OLAP analysis provides a rich end-user experience. This tutorial explains all the fundamental aspects of OBIEE.

    Audience

    This tutorial is designed for those who want to learn the basics of OBIEE and take advantage of its features to develop quality BI reports.

    Prerequisites

    Before proceeding with this tutorial, you need to have a good understanding of basic database concepts.

    Khóa học lập trình tại Toidayhoc vừa học vừa làm dự án vừa nhận lương: Khóa học lập trình nhận lương tại trung tâm Toidayhoc

  • Khóa học miễn phí OBIEE – Components nhận dự án làm có lương

    OBIEE – Components


    OBIEE components are mainly divided into two types of components −

    • Server Components
    • Client Components

    Server components are responsible to run OBIEE system and client components interact with user to create reports and dashboards.

    Server Components

    Following are the server components −

    • Oracle BI (OBIEE) Server
    • Oracle Presentation Server
    • Application Server
    • Scheduler
    • Cluster Controller

    Oracle BI Server

    This component is the heart of OBIEE system and is responsible to communicate with other components. It generates queries for report request and they are sent to database for execution.

    It is also responsible for managing repository components which are presented to the user for report generation, handles security mechanism, multi user environment, etc.

    OBIEE Presentation Server

    It takes the request from users via browser and passes all requests to OBIEE server.

    OBIEE Application Server

    OBIEE Application Server helps to work on client components and Oracle provides Oracle10g Application server with OBIEE suite.

    OBIEE Scheduler

    It is responsible to schedule jobs in OBIEE repository. When you create a repository, OBIEE also create a table inside the repository which saves all schedule-related information. This component is also mandatory to run agents in 11g.

    All jobs which are scheduled by the Scheduler can be monitored by the job manager.

    Client Components

    Following are some client components −

    Web-based OBIEE Client

    Following tools are provided in OBIEE web-based client −

    • Interactive Dashboards
    • Oracle Delivers
    • BI Publisher
    • BI Presentation Service Administrator
    • Answers
    • Disconnected Analytics
    • MS Office Plugin

    Non-Web based Client

    In Non-Web based client, following are the key components −

    • OBIEE Administration − It is used to build repositories and has three layers − Physical, Business, and Presentation.

    • ODBC Client − It is used to connect to database and execute SQL commands.


    Khóa học lập trình tại Toidayhoc vừa học vừa làm dự án vừa nhận lương: Khóa học lập trình nhận lương tại trung tâm Toidayhoc

  • Khóa học miễn phí OBIEE – Schema nhận dự án làm có lương

    OBIEE – Schema


    Schema is a logical description of the entire database. It includes the name and description of records of all types including all associated data-items and aggregates. Much like a database, DW also requires to maintain a schema. Database uses relational model, while DW uses Star, Snowflake, and Fact Constellation schema (Galaxy schema).

    Star Schema

    In a Star Schema, there are multiple dimension tables in de-normalized form that are joined to only one fact table. These tables are joined in a logical manner to meet some business requirement for analysis purpose. These schemas are multidimensional structures which are used to create reports using BI reporting tools.

    Dimensions in Star schemas contain a set of attributes and Fact tables contain foreign keys for all dimensions and measurement values.

    Star Schema

    In the above Star Schema, there is a fact table “Sales Fact” at the center and is joined to 4 dimension tables using primary keys. Dimension tables are not further normalized and this joining of tables is known as Star Schema in DW.

    Fact table also contains measure values − dollar_sold and units_sold.

    Snowflakes Schema

    In a Snowflakes Schema, there are multiple dimension tables in normalized form that are joined to only one fact table. These tables are joined in a logical manner to meet some business requirement for analysis purpose.

    Only difference between a Star and Snowflakes schema is that dimension tables are further normalized. The normalization splits up the data into additional tables. Due to normalization in the Snowflake schema, the data redundancy is reduced without losing any information and therefore it becomes easy to maintain and saves storage space.

    Snowflakes Schema

    In above Snowflakes Schema example, Product and Customer table are further normalized to save storage space. Sometimes, it also provides performance optimization when you execute a query that requires processing of rows directly in normalized table so it doesn’t process rows in primary Dimension table and comes directly to Normalized table in Schema.

    Granularity

    Granularity in a table represents the level of information stored in the table. High granularity of data means that data is at or near the transaction level, which has more detail. Low granularity means that data has low level of information.

    A fact table is usually designed at a low level of granularity. This means that we need to find the lowest level of information that can be stored in a fact table. In date dimension, the granularity level could be year, month, quarter, period, week, and day.

    The process of defining granularity consists of two steps −

    • Determining the dimensions that are to be included.
    • Determining the location to place the hierarchy of each dimension of information.

    Slowly Changing Dimensions

    Slowly changing dimensions refer to changing value of an attribute over time. It is one of the common concepts in DW.

    Example

    Andy is an employee of XYZ Inc. He was first located in New York City in July 2015. Original entry in the employee lookup table has the following record −

    Employee ID 10001
    Name Andy
    Location New York

    At a later date, he has relocated to LA, California. How should XYZ Inc. now modify its employee table to reflect this change?

    This is known as “Slowly Changing Dimension” concept.

    There are three ways to solve this type of problem −

    Solution 1

    The new record replaces the original record. No trace of the old record exists.

    Slowly Changing Dimension, the new information simply overwrites the original information. In other words, no history is kept.

    Employee ID 10001
    Name Andy
    Location LA, California
    • Benefit − This is the easiest way to handle the Slowly Changing Dimension problem as there is no need to keep track of the old information.

    • Disadvantage − All historical information is lost.

    • Use − Solution 1 should be used when it is not required for DW to keep track of historical information.

    Solution 2

    A new record is entered into the Employee dimension table. So the employee, Andy, is treated as two people.

    A new record is added to the table to represent the new information and both the original and new record will be present. The new record gets its own primary key as follows −

    Employee ID 10001 10002
    Name Andy Andy
    Location New York LA, California
    • Benefit − This method allows us to store all the historical information.

    • Disadvantage − Size of the table grows faster. When the number of rows for the table is very high, space and performance of table can be a concern.

    • Use − Solution 2 should be used when it is necessary for DW to keep historical data.

    Solution 3

    The original record in Employee dimension is modified to reflect the change.

    There will be two columns to indicate the particular attribute, one indicates original value and other indicates the new value. There will also be a column that indicates when the current value becomes active.

    Employee ID Name Original Location New Location Date Moved
    10001 Andy New York LA, California July 2015
    • Benefits − This does not increase the size of the table, since new information is updated. This allows us to keep historical information.

    • Disadvantage − This method doesn’t keep all history when an attribute value is changed more than once.

    • Use − Solution 3 should only be used when it is required for DW to keep information of historical changes.

    Normalization

    Normalization is the process of decomposing a table into less redundant smaller tables without losing any information. So Database normalization is the process of organizing the attributes and tables of a database to minimize data redundancy (duplicate data).

    Purpose of Normalization

    • It is used to eliminate certain types of data (redundancy/ replication) to improve consistency.

    • It provides maximum flexibility to meet future information needs by keeping tables corresponding to object types in their simplified forms.

    • It produces a clearer and readable data model.

    Advantages

    • Data integrity.
    • Enhances data consistency.
    • Reduces data redundancy and space required.
    • Reduces update cost.
    • Maximum flexibility in responding to ad-hoc queries.
    • Reduces the total number of rows per block.

    Disadvantages

    Slow performance of queries in database because joins have to be performed to retrieve relevant data from several normalized tables.

    You have to understand the data model in order to perform proper joins among several tables.

    Example

    Purpose of Normalization

    In the above example, the table inside the green block represents a normalized table of the one inside the red block. The table in green block is less redundant and also with less number of rows without losing any information.


    Khóa học lập trình tại Toidayhoc vừa học vừa làm dự án vừa nhận lương: Khóa học lập trình nhận lương tại trung tâm Toidayhoc