Author: alien

  • Khóa học miễn phí OBIEE – Dashboards nhận dự án làm có lương

    OBIEE – Dashboards


    OBIEE dashboard is a tool that enables end users to run ad-hoc reports and analysis as per business requirement model. Interactive dashboards are pixel perfect reports which can be directly viewed or printed by end users.

    OBIEE dashboard is part of Oracle BI Presentation layer services. If your end user is not interested in seeing all the data in the dashboard, it allows you to add prompts to the dashboard that allows the end user to enter what he wants to see. Dashboards also allow end users to select from drop-down lists, multi-select boxes and selection of columns to display in the reports.

    Dashboard Alerts

    Oracle BI dashboard allows you to set up alerts for sales executives that comes up on the interactive dashboard whenever the company’s projected sales is going to be below forecast.

    Create a New Dashboard

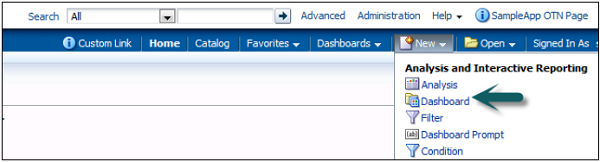
    To create a new Dashboard, go to New → Dashboard or you can also click on Dashboard option under create on the left side.

    Create New Dashboard

    Once you click on Dashboard, new dashboard dialog box opens up. Enter the name of Dashboard and description and select the location where you want Dashboard to save → click OK.

    New Dashboard

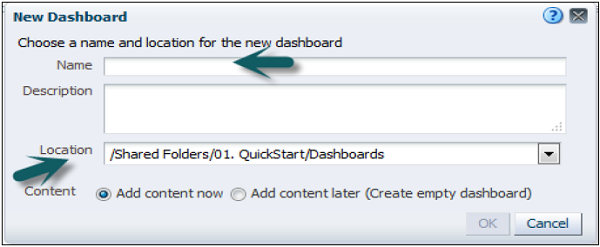
    If you save the dashboard in the Dashboards subfolder directly under the /Shared Folders/first level subfolder → dashboard will be listed in the Dashboard menu on the global header.

    If you save it in a Dashboards subfolder at any other level (such as /Shared Folders/Sales/Eastern), it will not be listed.

    If you choose a folder in the Dashboards subfolder directly under the /Shared Folders/first level subfolder in which no dashboards have been saved, a new Dashboards folder is automatically created for you.

    Once you enter the above fields, Dashboard builder will open up as shown in the following snapshot −

    Dashboard Builder

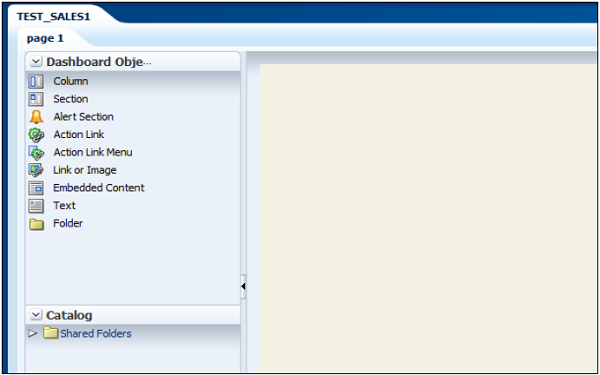
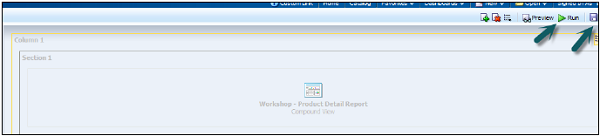
    Expand the catalog tab, select analysis to add to Dashboard and drag to page layout pane. Save and run the dashboard.

    Catalog Tab

    Edit a Dashboard

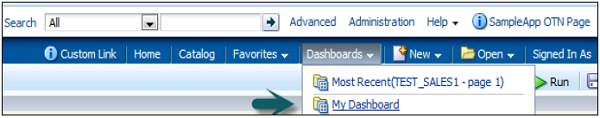
    Go to Dashboard → My Dashboard → Edit Dashboard.

    Edit Dashboard

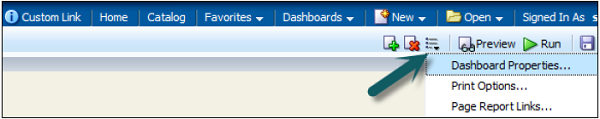
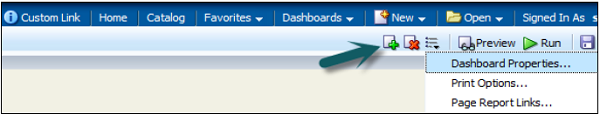
    To edit Dashboard. Click on below icon → Dashboard properties.

    Dashboard Properties Window

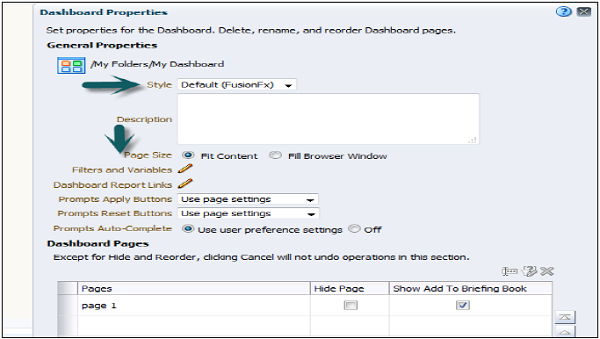
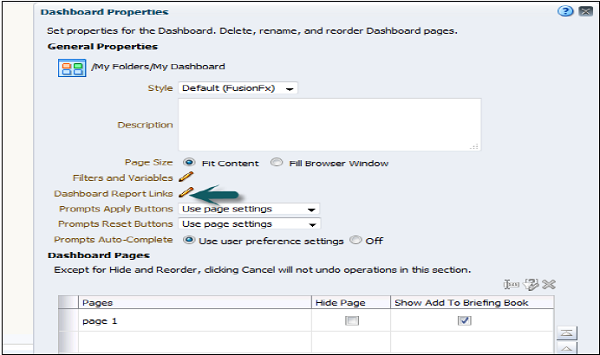
    A new dialog box will appear as shown in the following snapshot. You can perform the following tasks −

    Change the styles (Styles control how dashboards and results are formatted for display, such as the color of text and links, the font and size of text, the borders in tables, the colors and attributes of graphs, and so on). You can add a description.

    You can add hidden prompts, filters, and variables. Specify the links that will display with analyses on a dashboard page. You can rename, hide, reorder, set permissions for, and delete dashboard pages.

    Dashboard Properties

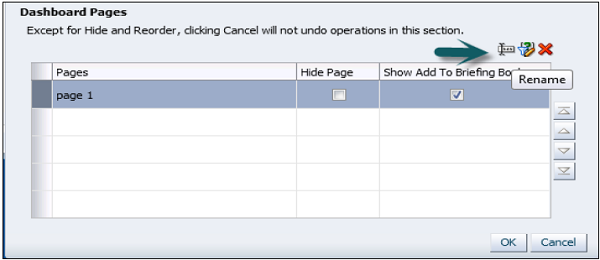
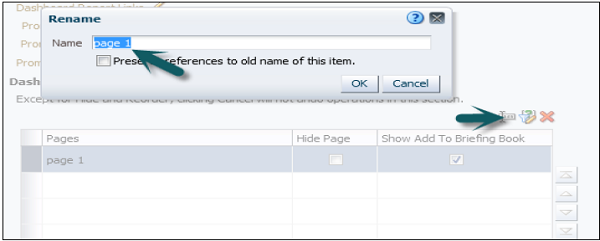
    You can also edit Dashboard page properties by selecting page in the dialog box. You can make the following changes −

    • You can change the name of your dashboard page.

    • You can add a hidden prompt. Hidden prompts are used to set default values for all corresponding prompts on a dashboard page.

    • You can add permissions for the dashboard and can also delete the selected page. Dashboard pages are permanently deleted.

    • If more than one dashboard page is in this dashboard, the arrange order icons are enabled using up and down arrows.

    Dashboard Pages Dashboard Rename Page

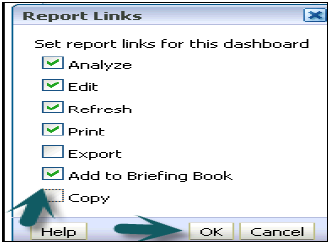
    To set the report links at the dashboard level, dashboard page, or analysis level click the edit option of Dashboard reporting links.

    Dashboard General Properties Report Links

    To add a dashboard page, click on new Dashboard page icon → Enter the name of dashboard page and click OK.

    Add New Dashboard Page

    In Catalog tab, you can add the new another analysis and drag it to page layout area of new dashboard page.

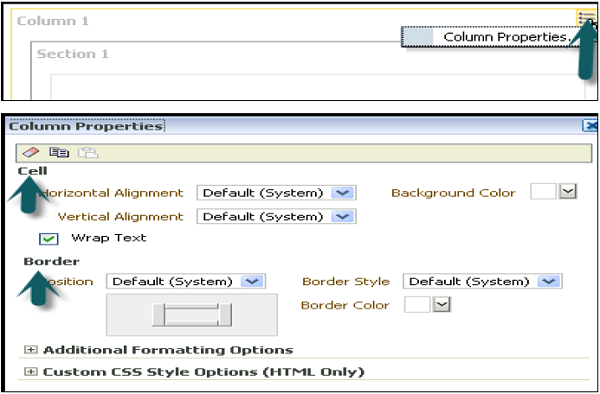
    To edit the properties of dashboard like cell width, border, and height, click on column properties. You can set background color, wrap text and additional formatting options.

    Column Properties

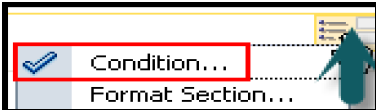
    You can also add a condition on dashboard data display by clicking on condition option in column properties −

    Add Condition

    To add a condition, click on + sign in condition dialog box. You can add a condition based on analysis.

    Select the condition data and enter the condition parameter.

    Section Condition

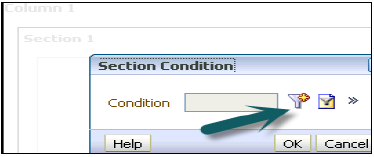
    You can also test, edit or remove the condition by clicking on ‘more’ sign next to + button.

    Save a Customized Dashboard

    You can save your customized dashboard by going to page options → Save current customizations → Enter the name of customization → Click OK.

    Save Customized Dashboard

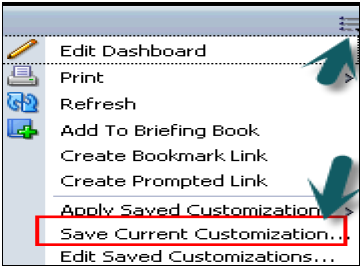
    To apply customization to a dashboard page, go to page option → Apply saved customization → Select name → Click OK.

    It allows you to save and view dashboard pages in their current state such as filters, prompts, column sorts, drills in analyses, and section expansion and collapse. By saving customizations, you do not need to make these choices manually each time you access the dashboard page.


    Khóa học lập trình tại Toidayhoc vừa học vừa làm dự án vừa nhận lương: Khóa học lập trình nhận lương tại trung tâm Toidayhoc

  • Khóa học miễn phí OBIEE – Filters nhận dự án làm có lương

    OBIEE – Filters


    Filters are used to limit the results that are displayed when an analysis is run, so that the results answer a particular question. Based on the filters, only those results are shown that matches the criteria passed in the filter condition.

    Filters are applied directly to attribute and measure columns. Filters are applied before the query is aggregated and affect the query and thus the resulting values for measures.

    For example, you have a list of members in which the aggregate sums to 100. Over time, more members meet the set filter criteria, which increases the aggregate sum to 200.

    Column Filters

    Following are the ways to create filters −

    Create a Named Column Filter

    Go to Oracle Business Intelligence homepage → New menu → Select filter. The Select Subject Area dialog is displayed.

    From the Select Subject Area dialog, choose the subject area for which you want to create a filter. The “Filter editor” is displayed from the “Subject Areas pane”. Double-click the column for which you want to create the filter. New Filter dialog is displayed.

    Create an Inline Filter

    Either create an analysis or access an existing analysis for which you want to create a filter.

    Click the Criteria tab → Locate the “Filters pane” → Click create a filter for the current subject area button. The analysis selected columns are displayed in the cascading menu.

    Select a column name from the menu or select the More Columns option to access the “Select Column dialog” from which you can select any column from the subject area.

    Once you select a column, the “New Filter dialog” is displayed.


    Khóa học lập trình tại Toidayhoc vừa học vừa làm dự án vừa nhận lương: Khóa học lập trình nhận lương tại trung tâm Toidayhoc

  • Khóa học miễn phí OBIEE – Variables nhận dự án làm có lương

    OBIEE – Variables


    In OBIEE, there are two types of variables that are commonly used −

    • Repository variables
    • Session variables

    Apart from this you can also define Presentation and Request variables.

    Repository Variables

    A Repository variable has a single value at any point of time. Repository variables are defined using Oracle BI Administration tool. Repository variables can be used in place of constants in Expression Builder Wizard.

    There are two types of Repository variables −

    • Static repository variables
    • Dynamic repository variables

    Static repository variables are defined in variable dialog box and their value exists until they are changed by the administrator.

    Static repository variables contain default initializers that are numeric or character values. In addition, you can use Expression Builder to insert a constant as the default initializer, such as date, time, etc. You cannot use any other value or expression as the default initializer for a static repository variable.

    In older BI versions, the Administrator tool did not limit value of static repository variables. You may get warning in consistency check if your repository has been upgraded from older versions. In such case, update the static repository variables so that default initializers have a constant value.

    Dynamic repository variables are same as static variables but the values are refreshed by data returned from queries. When defining a dynamic repository variable, you create an initialization block or use a preexisting one that contains a SQL query. You can also set up a schedule that the Oracle BI Server will follow to execute the query and refresh the value of the variable periodically.

    When the value of a dynamic repository variable changes, all cache entries associated with a business model are deleted automatically.

    Each query can refresh several variables: one variable for each column in the query. You schedule these queries to be executed by the Oracle BI server.

    Dynamic repository variables are useful for defining the content of logical table sources. For example, suppose you have two sources for information about orders. One source contains current orders and the other contains historical data.

    Create Repository Variables

    In the Administration Tool → Go to Manage → Select Variables → Variable Manager → Go to Action → New → Repository > Variable.

    In the Variable dialog, type a name for the variable (Names for all variables should be unique) → Select the type of variable – Static or Dynamic.

    If you select dynamic variable, use the initialization block list to select an existing initialization block that will be used to refresh the value on a continuing basis.

    To create a new initialization block → Click New. To add a default initializer value, type the value in the default initializer box, or click the Expression Builder button to use Expression Builder.

    For static repository variables, the value you specify in the default initializer window persists. It will not change unless you change it. If you initialize a variable using a character string, enclose the string in single quotes. Static repository variables must have default initializers that are constant values → Click OK to close the dialog box.

    Session Variables

    Session variables are similar to dynamic repository variables and they obtain their values from initialization blocks. When a user begins a session, the Oracle BI server creates new instances of session variables and initializes them.

    There are as many instances of a session variable as there are active sessions on the Oracle BI server. Each instance of a session variable could be initialized to a different value.

    There are two types of Session variables −

    • System session variables
    • Non-system session variables

    System session variables are used by Oracle BI and Presentation server for specific purposes. They have predefined reserved names which can’t be used by other variables.

    USER

    This variable holds the value the user enters with login name. This variable is typically populated from the LDAP profile of the user.

    USERGUID

    This variable contains the Global Unique Identifier (GUID) of the user and it is populated from the LDAP profile of the user.

    GROUP

    It contains the groups to which the user belongs. When a user belongs to multiple groups, include the group names in the same column, separated by semicolons (Example – GroupA;GroupB;GroupC). If a semicolon must be included as part of a group name, precede the semicolon with a backslash character ().

    ROLES

    This variable contains the application roles to which the user belongs. When a user belongs to multiple roles, include the role names in the same column, separated by semicolons (Example – RoleA;RoleB;RoleC). If a semicolon must be included as part of a role name, precede the semicolon with a backslash character ().

    ROLEGUIDS

    It contains the GUIDs for the application roles to which the user belongs. GUIDs for application roles are the same as the application role names.

    PERMISSIONS

    It contains the permissions held by the user. Example – oracle.bi.server.manageRepositories.

    Non-system session variables are used for setting the user filters. Example, you could define a non-system variable called Sale_Region that would be initialized to the name of the sale_region of the user.

    Create Session Variables

    In the Administration Tool → Go to Manage → Select Variables.

    In the Variable Manager dialog, click Action → New → Session → Variable.

    In the Session Variable dialog, enter variable name (Names for all variables should be unique and names of system session variables are reserved and cannot be used for other types of variables).

    For session variables, you can select the following options −

    • Enable any user to set the value − This option is used to set session variables after the initialization block has populated the value. Example – this option lets non-administrators set this variable for sampling.

    • Security sensitive − This is used to identify the variable as sensitive to security when using a row-level database security strategy, such as a Virtual Private Database (VPD).

    You can use the initialization block list option to choose an initialization block that will be used to refresh the value regularly. You can also create a new initialization block.

    To add a default initializer value, enter the value in the default initializer box or click the Expression Builder button to use Expression Builder. Click OK to close the dialog box.

    The administrator can create non-system session variables using Oracle BI Administration tool.

    Presentation Variables

    Presentation variables are created with creation of Dashboard prompts. There are two types of dashboard prompts that can be used −

    Column Prompt

    Presentation variable created with column prompt is associated with a column, and the values that it can take comes from the column values.

    To create a presentation variable go to New Prompt dialog or Edit Prompt dialog → Select Presentation Variable in the Set of a variable field → Enter the name for the variable.

    Variable Prompt

    Presentation variable created as variable prompt is not associated with any column and you need to define its values.

    To create a presentation variable as part of a variable prompt, in the New Prompt dialog or Edit Prompt dialog → Select Presentation Variable in the Prompt for field → Enter the name for the variable.

    The value of a presentation variable is populated by the column or variable prompt with which it is created. Each time a user selects a value in the column or variable prompt, the value of the presentation variable is set to the value that the user selects.

    Initialization Blocks

    Initialization blocks are used to initialize OBIEE variables: Dynamic Repository variables, system session variables and non-system session variables.

    It contains SQL statement that are executed to initialize or refresh the variables associated with that block. The SQL statement that are executed points to physical tables that can be accessed using the connection pool. Connection pool is defined in the initialization block dialog.

    If you want the query for an initialization block to have database-specific SQL, you can select a database type for that query.

    Initialize Dynamic Repository Variables using Initialization Block

    Default initiation string field of initialization block is used to set value of dynamic repository variables. You also define a schedule which is followed by Oracle BI server to execute the query and refresh the value of variable. If you set the logging level to 2 or higher, log information for all SQL queries executed to retrieve the value of variable is saved in nqquery.log file.

    Location of this file on BI Server −

    ORACLE_INSTANCEdiagnosticslogsOracleBIServerComponentcoreapplication_obisn

    Initialize Session Variables using Initialization Block

    Session variables also take their values from initialization block but their value never changes with time intervals. When a user begins a new session, Oracle BI server creates a new instance of session variables.

    All SQL queries executed to retrieve session variable information by BI server if the logging level is set to 2 or higher in the Identity Manager User object or the LOGLEVEL system session variable is set to 2 or higher in the Variable Manager is saved in nqquery.log file.

    Location of this file on BI Server −

    ORACLE_INSTANCEdiagnosticslogsOracleBIServerComponentcoreapplication_obisn

    Create Initialization Blocks in Administrator Tool

    Go to Manager → Variables → Variable Manager Dialog box appears. Go to Action menu → Click New → Repository → Initialization Block → Enter the name of initialization block.

    Go to Schedule tab → Select start date and time and refresh interval.

    You can choose the following options for Initialization Blocks −

    • Disable − If you select this option, initialization block is disabled. To enable an initialization block, right-click an existing initialization block in the Variable Manager and choose Enable. This option enables you to change this property without opening the initialization block dialog.

    • Allow deferred execution − This allows you to defer the execution of the initialization block until an associated session variable is accessed for the first time during the session.

    • Required for authentication − If you select this, initialization block must execute for users to log in. Users are denied access to Oracle BI if the initialization block doesn’t execute.


    Khóa học lập trình tại Toidayhoc vừa học vừa làm dự án vừa nhận lương: Khóa học lập trình nhận lương tại trung tâm Toidayhoc

  • Khóa học miễn phí OBIEE – Calculation Measures nhận dự án làm có lương

    OBIEE – Calculation Measures


    Calculated measures is used to perform calculation of facts in logical tables. It defines Aggregation functions in Aggregation tab of logical column in the repository.

    Create New Measure

    Measures are defined in logical fact tables in repository. Any column with an aggregation function applied on it is called a measure.

    Common measure examples are − Unit Price, quantity sold, etc.

    Following are the guidelines to create measures in OBIEE −

    • All aggregation should be performed from a fact logical table and not from a dimension logical table.

    • All columns that cannot be aggregated should be expressed in a dimension logical table and not in a fact logical table.

    Calculated measures can be defined in two ways in logical tables at BMM layer in Administration tool −

    • Aggregations in logical tables.
    • Aggregations in logical table source.

    Create Calculated Measures in Logical Tables using Administration Tool

    Double-click on the column name in the logical Fact table, you will see the following dialog box.

    Logical Fact Table

    Go to Aggregation tab and select the Aggregate function from the drop-down list → Click OK.

    Aggregation Function

    You can add new measures using functions in Expression builder wizard in Column source. Measures represent data that is additive, such as total revenue or total quantity. Click on the save option at the top to save the repository. This is also called creating measures at logical level.

    Create Calculated Measures in Logical Table Source using Administration Tool

    You can define Aggregations by a double-click on Logical table source to open logical table dialogue box.

    Logical Table Source Using Administration Tool

    Click on Expression builder wizard to define expression.

    In Expression builder, you can choose multiple options like – Category, functions, and mathematical functions.

    Once you select the category, it will show the subcategories inside it. Select the subcategory and mathematical function, and click on the arrow mark to insert it.

    Expression Builder

    Now to edit the value to create measures, click on source number, enter the calculated value like multiple and divide → Go to Category and select logical table → Select column to apply this multiple/division to an existing column value.

    Logical Table Category

    Click OK to close the Expression builder. Again click OK to close the dialog box.


    Khóa học lập trình tại Toidayhoc vừa học vừa làm dự án vừa nhận lương: Khóa học lập trình nhận lương tại trung tâm Toidayhoc

  • Khóa học miễn phí OBIEE – Aggregates nhận dự án làm có lương

    OBIEE – Aggregates


    Aggregations are used to implement query performance optimization while running the reports. This eliminates the time taken by query to run the calculations and delivers the results at fast speed. Aggregate tables has less number of rows as compared to a normal table.

    How Aggregation Works in OBIEE?

    When you execute a query in OBIEE, BI server looks for the resources which has information to answer the query. Out of all available sources, the server selects the most aggregated source to answer that query.

    Adding Aggregation in a Repository

    Open the Repository in an offline mode in the Administrator tool. Go to File → Open → Offline.

    Import the metadata and create logical table source in BMM layer. Expand the table name and click on source table name to open logical table source dialog box.

    Go to column mapping tab to see map columns in Physical table. Go to content tab → Aggregate content group by selecting the logical level.

    Adding Aggregation in Repository

    You can select different logical levels as per the columns in fact tables like Product Total, Total Revenue, and Quarter/Year for Time as per dimension hierarchies.

    Select Different Logical Levels

    Click OK to close dialog box → save the repository.

    When you define Aggregate in logical fact tables they are defined as per dimension hierarchies.


    Khóa học lập trình tại Toidayhoc vừa học vừa làm dự án vừa nhận lương: Khóa học lập trình nhận lương tại trung tâm Toidayhoc

  • Khóa học miễn phí OBIEE – Dimension Hierarchies nhận dự án làm có lương

    OBIEE – Dimension Hierarchies


    Hierarchies is a series of many-to-one relationships and can be of different levels. A Region hierarchy consists of: Region → Country → State → City → Street. Hierarchies follow top-down or bottom-up approach.

    Logical dimensions or dimension hierarchies are created in BMM layer. There are two types of dimensional hierarchies that are possible −

    • Dimensions with level-based hierarchies.
    • Dimension with Parent-Child hierarchies.

    In level-based hierarchies, members can be of different types and members of the same type come only at single level.

    In Parent-Child hierarchies, all members are of the same type.

    Dimensions with Level-based Hierarchies

    Level-based dimension hierarchies can also contain parent-child relationships. The common sequence to create level-based hierarchies is to start with grand total level and then working down to lower levels.

    Level-based hierarchies allows you to perform −

    • Level-based calculated measures.
    • Aggregate navigation.
    • Drill down to child level in dashboards.

    Each dimension can only have one grand total level and it doesn’t have a level key or dimension attributes. You can associate measures with grand total level and default aggregation for these measures are grand total always.

    All lower levels should have at least one column and each dimension contains one or more hierarchies. Each lower level also contains a level key which defines unique value at that level.

    Types of Level-based Hierarchies

    Unbalanced Hierarchies

    Unbalanced hierarchies are those where all the lower levels don’t have the same depth.

    Example − For one product, for one month you can have data for weeks and for other month you can have data available for day level.

    Skip Level Hierarchies

    In skip-level hierarchies, few members don’t have values at higher level.

    Example − For one city, you have state → country → Region. However for other city, you have only state and it doesn’t fall under any country or region.

    Dimension with Parent-child Hierarchies

    In parent-child hierarchy, all the members are of the same type. The most common example of parent-child hierarchy is the reporting structure in an organization. Parent-child hierarchy is based on a single logical table. Each row contains two keys – one for the member and another for the parent of the member.


    Khóa học lập trình tại Toidayhoc vừa học vừa làm dự án vừa nhận lương: Khóa học lập trình nhận lương tại trung tâm Toidayhoc

  • Khóa học miễn phí OBIEE – Multiple Logical Table nhận dự án làm có lương

    OBIEE – Multiple Logical Table Sources


    When you drag and drop a column from a physical table that is not currently being used in your logical table in BMM layer, the physical table containing such column gets added as a new Logical Table Source (LTS).

    When in BMM layer, you use more than one table as source table, it is called multiple logical table sources. You can have a Fact table as multiple logical table sources when it uses different physical tables as source.

    Example

    Multiple LTS are used to convert Snowflakes schema to Star schemas in BMM layer.

    Let us say you have two dimensions − Dim_Emp and Dim_Dept and one fact table FCT_Attendance in the Physical layer.

    Here your Dim_Emp is normalized to Dim_Dept to implement Snowflakes schema. So in your Physical diagram, it would be like this −

    Dim_Dept<------Dim_Emp <-------FCT_Attendance
    

    When we move these table to the BMM layer, we will create a single dimension table Dim_Employee with 2 logical sources corresponding to Dim_Emp and Dim_Dept. In your BMM diagram −

    Dim_Employee <-----------FCT_Attendance
    

    This is one approach where you can use concept of multiple LTS in BMM layer.

    Specifying Content

    When you use multiple physical tables as sources, you expand table sources in BMM diagram. It shows all multiple LTS from where it is picking up the data in BMM layer.

    To see table mapping in BMM layer, expand the sources under logical table in BMM layer. It will open Logical table source mapping dialogue box. You can check all tables which are mapped to provide data in logical table.

    Specifying Content

    Khóa học lập trình tại Toidayhoc vừa học vừa làm dự án vừa nhận lương: Khóa học lập trình nhận lương tại trung tâm Toidayhoc

  • Khóa học miễn phí OBIEE – Level-Based Measures nhận dự án làm có lương

    OBIEE – Level-Based Measures


    Level-based measures are created to perform calculation at a specific level of aggregation. They allow to return data at multiple levels of aggregation with one single query. It also allows to create share measures.

    Example

    Let us say there is a company XYZ Electronics which sells its products in many regions, countries and cities. Now the company President wants to see the total revenue at country level – one level below region and one level above cities. So total revenue measure should be summed up to the country level.

    These type of measures are called level-based measures. Similarly, you can apply level-based measures on the time hierarchies.

    Once the dimension hierarchies are created, level-based measures can be created by double clicking on the total revenue column in the logical table and setting the level in the levels tab.

    Create Level-Based Measures

    Open the repository in offline mode. Go to File → Open → Offline.

    Select .rpd file and click open → Enter repository password and click Ok.

    In BMM layer, right-click on Total Revenue column → New Object → Logical column.

    Create Level-Based Measures

    It will open the logical column dialog box. Enter the name of logical column total revenue. Go to column source tab → Check derived from existing columns using an expression.

    Logical Column Dialog Box

    Once you select this option, expression edit wizard will be highlighted. In expression builder wizard, select the logical table → Column name → Total revenue from the left side menu → Click OK.

    Now go to level tab in logical column dialog box → Click on logical dimension to select it as grand total under logical level. This specifies that the measure should be calculated at grand total level in the dimension hierarchy.

    Grand Total Level

    Once you click OK → Total Revenue logical table will appear under the logical dimension and Fact tables.

    This column can be dragged to presentation layer in the subject area to be used by end users to generate reports. You can drag this column from fact tables or from logical dimension.


    Khóa học lập trình tại Toidayhoc vừa học vừa làm dự án vừa nhận lương: Khóa học lập trình nhận lương tại trung tâm Toidayhoc

  • Khóa học miễn phí OBIEE – Testing Repository nhận dự án làm có lương

    OBIEE – Testing Repository


    You can check the repository for errors by using the consistency checking option. Once it is done, next step is to load the repository into Oracle BI Server. Then test the repository by running an Oracle BI analysis and verifying the results.

    Go to File → click on Check Global Consistency → You will receive the following message → Click Yes.

    Testing Repository

    Once you click OK → Business model under BMM will change to Green → Click on save the repository without checking global consistency again.

    Disable Caching

    To improve query performance, it is advised to disable BI server cache option.

    Open a browser and enter the following URL to open Fusion Middleware Control Enterprise Manager: http://<machine name>:7001/em

    Enter the user name and password. Click Login.

    On the left side, expand Business Intelligence → coreapplication → Capacity Management tab → Performance.

    Testing Repository Disable Caching

    Enable BI Server Cache section is by default checked → Click on Lock and Edit Configuration → Close.

    Testing Repository Enable BI Server

    Now deselect cache enabled option. It is used to improve query performance. Go to Apply → Activate Changes → Completed Successfully.

    Load the Repository

    Go to Deployment tab → Repository → Lock and Edit Configuration → Completed Successfully.

    Load Testing Repository

    Click on Upload BI Server Repository section → Browse to open the Choose file dialog box → select the Repository .rpd file and click Open → Enter Repository password → Apply → Activate Changes.

    Upload BI Server Repository

    Activate Changes → Completed Successfully → Click on Restart to apply recent changes option at the top → Click Yes.

    Testing Repository Completed Successfully

    Repository is successfully created and loaded for query analysis.

    Enable Query Logging

    You can set up query logging level for individual users in OBIEE. Logging level controls the information that you will retrieve in log file.

    Set Up Query Logging

    Open the Administration tool → Go to File → Open → Online.

    Online mode is used to edit the repository in Oracle BI server. To open a repository in online mode, your Oracle BI server should be running.

    Set Up Query Logging

    Enter the Repository password and user name password to login and click Open to open the repository.

    Repository Password

    Go to Manage → Identity → Security Manager Window will open. Click BI Repository on the left side and double-click on Administrative user → User dialogue box will open.

    Security Manager

    Click User tab in user dialogue box, you can set logging levels here.

    In normal scenario − The user has a logging level set to 0 and the administrator has a logging level set to 2. Logging level can have values starting from Level 0 to level 5. Level 0 means no logging and Level 5 means maximum logging level information.

    Logging Level Descriptions

    Level 0 No logging
    Level 1

    Logs the SQL statement issued from the client application

    Logs elapsed times for query compilation, query execution, query cache processing, and back-end database processing

    Logs the query status (success, failure, termination, or timeout). Logs the users ID, session ID, and request ID for each query

    Level 2

    Logs everything logged in Level 1

    Additionally, for each query, logs the repository name, business model name, presentation catalog (called Subject Area in Answer) name, SQL for the queries issued against physical databases, queries issued against the cache, number of rows returned from each query against a physical database and from queries issued against the cache, and the number of rows returned to the client application

    Level 3

    Logs everything logged in Level 2

    Additionally, adds a log entry for the logical query plan, when a query that was supposed to seed the cache was not inserted into the cache, when existing cache entries are purged to make room for the current query, and when the attempt to udate the exact match hit detector fails

    Level 4

    Logs everything logged in Level 3

    Additionally, logs the query execution plan.

    Level 5

    Logs everything logged in Level 4

    Additionally, logs intermediate row counts at various points in the execution plan.

    To Set Logging Level

    In user dialogue box, enter value for logging level.

    Set Logging Level

    Once you click OK, it will open the checkout dialogue box. Click Checkout. Close the Security Manager.

    Check Out Objects

    Go to file → Click on check-in changes → Save the repository using the Save option at the top → To take changes in effect → Click OK.

    Check in Changes

    Use Query Log to Verify Queries

    You can check query logs once query logging level is set by going to Oracle Enterprise Manager and this helps to verify queries.

    To check the query logs to verify queries, go to Oracle Enterprise Manager OEM.

    Go to diagnostic tab → click Log messages.

    Verify Queries Using Query Log

    Scroll down to bottom in log messages to see Server, Scheduler, Action Services and other log details. Click on Server log to open log messages box.

    You can select various filters − Date Range, Message types and message contains/not contains fields, etc. as shown in the following snapshot −

    Log Messages

    Once you click on search, it will show log messages as per filters.

    Filter Log Messages

    Clicking on collapse button allows you to check details of all log messages for queries.


    Khóa học lập trình tại Toidayhoc vừa học vừa làm dự án vừa nhận lương: Khóa học lập trình nhận lương tại trung tâm Toidayhoc

  • Khóa học miễn phí OBIEE – Business Layer nhận dự án làm có lương

    OBIEE – Business Layer


    Business Layer defines the business or logical model of objects and their mapping between business model and Schema in the physical layer. It simplifies the Physical Schema and maps the user business requirement to physical tables.

    The business model and mapping layer of OBIEE system administration tool can contain one or more business model objects. A business model object defines the business model definitions and the mappings from logical to physical tables for the business model.

    The business model is used to simplify the schema structure and maps the users’ business requirement to physical data source. It involves creation of logical tables and columns in the business model. Each logical table can have one or more physical objects as sources.

    There are two categories of logical tables − fact and dimension. Logical fact tables contain the measures on which analysis is done and Logical dimension tables contain the information about measures and objects in Schema.

    While creating a new repository using OBIEE administration tool, once you define the physical layer, create joins and identify foreign keys. The next step is to create a business model and mapping BMM layer of the repository.

    Steps involved in defining Business Layer −

    • Create a business model
    • Examine logical joins
    • Examine logical columns
    • Examine logical table sources
    • Rename logical table objects manually
    • Rename logical table objects using the rename wizard and delete unnecessary logical object
    • Creating measures (Aggregations)

    Create Business Layer in the Repository

    To create a business layer in the repository, right-click → New Business Model → Enter the name of Business Model and click OK. You can also add description of this Business Model if you want.

    Create Business Layer1 Create Business Layer2

    Logical Tables and Objects in BMM Layer

    Logical tables in OBIEE repository exist in the Business Model and Mapping BMM layer. The business model diagram should contain at least two logical tables and you need to define relationships between them.

    Each logical table should have one or more logical columns and one or more logical table sources associated with it. You can also change the logical table name, reorder the objects in logical table and define logical joins using primary and foreign keys.

    Create Logical Tables Under BMM Layer

    There are two ways of creating logical tables/objects in BMM layer −

    First method is dragging physical tables to Business Model which is the fastest way of defining logical tables. When you drag the tables from the physical layer to BMM layer, it also preserves the joins and keys automatically. If you want you can change the joins and keys in logical tables, it doesn’t affect objects in the physical layer.

    Select physical tables/alias tables under the physical layer that you want to add to Business Model Layer and drag those table under BMM layer.

    These tables are known as logical tables and columns are called Logical objects in Business Model and Mapping Layer.

    Create Logical Tables Under BMM Layer1

    Second method is to create a logical table manually. In the Business Model and Mapping layer, right-click the business model → Select New Object → Logical Table → Logical Table dialog box appears.

    Go to General tab → Enter name for the logical table → Type a description of the table → Click OK.

    Create Logical Tables Under BMM Layer2

    Create Logical Columns

    Logical columns in BMM layer are automatically created when you drag tables from the physical layer to the business model layer.

    If the logical column is a primary key, this column is displayed with the key icon. If the column has an aggregation function, it is displayed with a sigma icon. You can also reorder logical columns in the Business Model and Mapping layer.

    Create a Logical Column

    In BMM layer, right-click on logical table → select New Object → Logical Column → Logical Column dialog box will appear, click General tab.

    Type a name for the logical column. The name of the business model and the logical table appear in the “Belongs to Table” field just below column name → click OK.

    Create Logical Column

    You can also apply Aggregations on the logical columns. Click Aggregation tab → Select Aggregation rule from the dropdown list → Click OK.

    Once you apply Aggregate function on a column, logical column icon is changed to show Aggregation rule is applied.

    Apply Aggregate Function

    You can also move or copy logical column in tables −

    In the BMM layer, you can select multiple columns to move. In the Sources for moved columns dialog box, in the Action area, select an action. If you select Ignore, no logical source will be added in the Sources folder of the table.

    If you click on Create new, a copy of the logical source with the logical column will be created in the Sources folder. If you select Use existing option, from the drop-down list, you must select a logical source from the Sources folder of the table.

    Create Logical Complex Joins / Logical Foreign Keys

    Logical tables in BMM layer are joined to each other using logical joins. Cardinality is one of the key defining parameter in logical joins. Cardinality relation one-to-many means that each row in first logical dimension table there are 0, 1, many rows in second logical table.

    Conditions to Create Logical Joins Automatically

    When you drag all the tables of the physical layer to business model layer, logical joins are automatically created in Repository. This condition rarely happens only in case of simple business models.

    When logical joins are same as physical joins, they are automatically created. Logical joins in BMM layer are created in two ways −

    • Business Model Diagram (already covered while designing repository)
    • Joins Manager

    Logical joins in BMM layer cannot be specified using expressions or columns on which to create the join like in the physical layer where expressions and column names are shown on which physical joins are defined.

    Create Logical Joins/Logical Foreign keys Using Join Manager Tool

    First let us see how to create logical foreign keys using Join Manager.

    In the Administration Tool toolbar, go to Manage → Joins. The Joins Manager dialog box appears → Go to Action tab → New → Logical Foreign Key.

    Now in the Browse dialog box, double-click a table → The Logical Foreign Key dialog box appears → Enter the name for the foreign key → From Table drop-down list of the dialog box, select the table that the foreign key references → Select the columns in the left table that the foreign key references → Select the columns in the right table that make up the foreign key columns → Select the join type from the Type drop-down list. To open the Expression Builder, click the button to the right of the Expression pane → The expression displays in the Expression pane → click OK to save the work.

    Create a Logical Complex Join using Join Manager

    Logical complex joins are recommended in Business Model and mapping layer as compared to the use of logical foreign keys.

    In the Administration Tool toolbar, go to Manage → Join → Joins Manager dialog box appears → Go to Action → Click New → Logical Complex Join.

    It will open a logical Join dialog box → Type a name for the complex join → In the table drop-down lists on the left and right side of the dialog box, select the tables that the complex join references → Select the join type from the Type drop-down list → Click OK.

    Note − You can also define a table as driving table from the drop-down list. This is used for performance optimization when the table size is too large. If the table size is small, less than 1000 rows, it shouldn’t be defined as driving table as it can result in performance degradation.

    Dimensions and Hierarchical Levels

    Logical dimensions exist in BMM and Presentation layer of OBIEE repository. Creating logical dimensions with hierarchies allows you to define aggregation rules that vary with dimensions. It also provides a drill-down option on the charts and tables in analyses and dashboards, and define the content of aggregate sources.

    Create logical dimension with Hierarchical level

    Open the Repository in Offline mode → Go to File → Open → Offline → Select Repository .rpd file and click on open → Enter Repository password → click OK.

    Next step is to create logical dimension and logical levels.

    Right click on Business model name in BMM layer → New Object → Logical Dimension → Dimension with level-based hierarchy. It will open the dialogue box → Enter the name → click OK.

    Logical Dimension

    To create a logical level, right-click on logical dimension → New Object → Logical Level.

    Logical Dimension New Object

    Enter the name of logical level example: Product_Name

    If this level is Grand total level, select the checkbox and the system will set number of element at this level to 1 by default → Click OK.

    If you want the logical level to roll up to its parent, select the Supports rollup to parent elements checkbox → click OK.

    If the logical level is not the grand total level and does not roll up, do not select any of the checkbox → Click OK.

    Logical Level

    Parent-Child Hierarchies

    You can also add parent-child hierarchies in logical level by following these steps −

    To define child logical levels, click Add in the Browse dialog box, select the child logical levels and click OK.

    You can also right-click on logical level → New Object → Child level.

    Parent-Child Hierarchies

    Enter the name of child level → Ok. You can repeat this to add multiple child levels for all logical columns as per requirement. You can also add Time and Region hierarchies in a similar way.

    Now to add logical columns of a table to logical level → select logical column in BMM layer and drag it to logical level child name to which you want to map. Similarly you can drag all the columns of logical table to create parent-child hierarchies.

    When you create a child level, it can be checked by a double-click on the logical level and it is displayed under child levels list of that level. You can add or delete child levels by using ‘&plus;’ or ‘X’ option on top of this box.

    Child Level

    Add Calculation to a Fact Table

    Double-click on the column name in logical Fact table → Go to Aggregation tab and select the Aggregate function from the drop-down list → Click OK.

    Add Calculation to Fact Table

    Measures represents data that is additive, such as total revenue or total quantity. Click on save option at the top to save the repository.

    There are various Aggregate functions that can be used like Sum, Average, Count, Max, Min, etc.


    Khóa học lập trình tại Toidayhoc vừa học vừa làm dự án vừa nhận lương: Khóa học lập trình nhận lương tại trung tâm Toidayhoc