obiee
Khóa học miễn phí OBIEE – Dashboards nhận dự án làm có lương
OBIEE â Dashboards
OBIEE dashboard is a tool that enables end users to run ad-hoc reports and analysis as per business requirement model. Interactive dashboards are pixel perfect reports which can be directly viewed or printed by end users.
OBIEE dashboard is part of Oracle BI Presentation layer services. If your end user is not interested in seeing all the data in the dashboard, it allows you to add prompts to the dashboard that allows the end user to enter what he wants to see. Dashboards also allow end users to select from drop-down lists, multi-select boxes and selection of columns to display in the reports.
Dashboard Alerts
Oracle BI dashboard allows you to set up alerts for sales executives that comes up on the interactive dashboard whenever the companyâs projected sales is going to be below forecast.
Create a New Dashboard
To create a new Dashboard, go to New → Dashboard or you can also click on Dashboard option under create on the left side.

Once you click on Dashboard, new dashboard dialog box opens up. Enter the name of Dashboard and description and select the location where you want Dashboard to save → click OK.
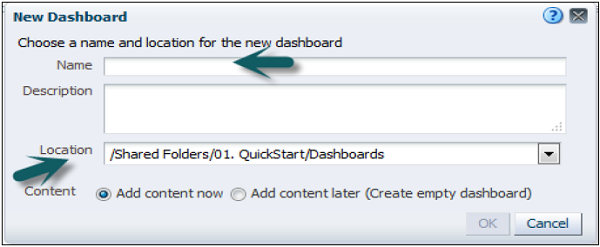
If you save the dashboard in the Dashboards subfolder directly under the /Shared Folders/first level subfolder → dashboard will be listed in the Dashboard menu on the global header.
If you save it in a Dashboards subfolder at any other level (such as /Shared Folders/Sales/Eastern), it will not be listed.
If you choose a folder in the Dashboards subfolder directly under the /Shared Folders/first level subfolder in which no dashboards have been saved, a new Dashboards folder is automatically created for you.
Once you enter the above fields, Dashboard builder will open up as shown in the following snapshot −
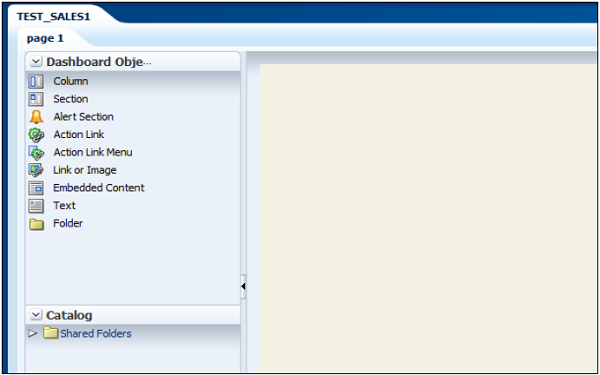
Expand the catalog tab, select analysis to add to Dashboard and drag to page layout pane. Save and run the dashboard.

Edit a Dashboard
Go to Dashboard → My Dashboard → Edit Dashboard.

To edit Dashboard. Click on below icon → Dashboard properties.

A new dialog box will appear as shown in the following snapshot. You can perform the following tasks −
Change the styles (Styles control how dashboards and results are formatted for display, such as the color of text and links, the font and size of text, the borders in tables, the colors and attributes of graphs, and so on). You can add a description.
You can add hidden prompts, filters, and variables. Specify the links that will display with analyses on a dashboard page. You can rename, hide, reorder, set permissions for, and delete dashboard pages.
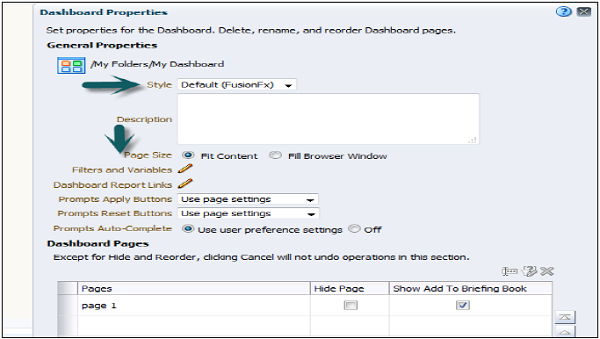
You can also edit Dashboard page properties by selecting page in the dialog box. You can make the following changes −
-
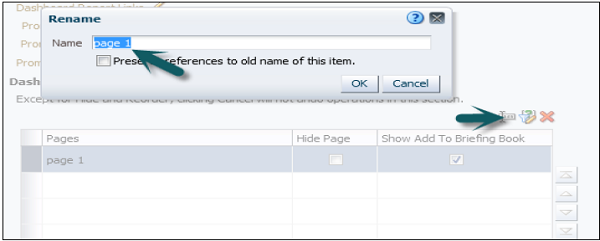
You can change the name of your dashboard page.
-
You can add a hidden prompt. Hidden prompts are used to set default values for all corresponding prompts on a dashboard page.
-
You can add permissions for the dashboard and can also delete the selected page. Dashboard pages are permanently deleted.
-
If more than one dashboard page is in this dashboard, the arrange order icons are enabled using up and down arrows.
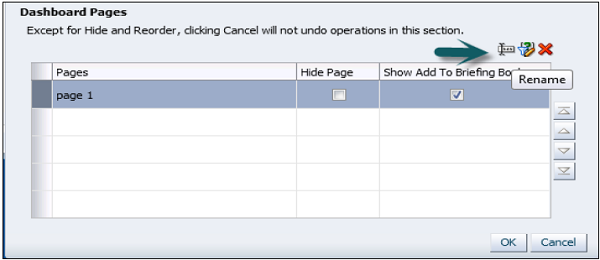
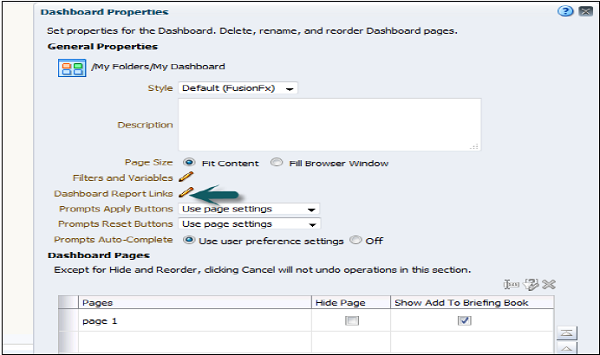
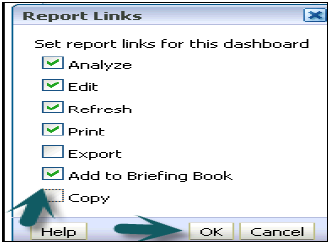
To set the report links at the dashboard level, dashboard page, or analysis level click the edit option of Dashboard reporting links.
To add a dashboard page, click on new Dashboard page icon → Enter the name of dashboard page and click OK.

In Catalog tab, you can add the new another analysis and drag it to page layout area of new dashboard page.
To edit the properties of dashboard like cell width, border, and height, click on column properties. You can set background color, wrap text and additional formatting options.
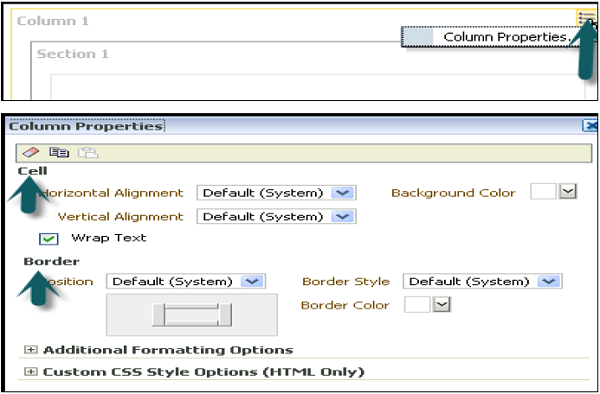
You can also add a condition on dashboard data display by clicking on condition option in column properties −

To add a condition, click on + sign in condition dialog box. You can add a condition based on analysis.
Select the condition data and enter the condition parameter.
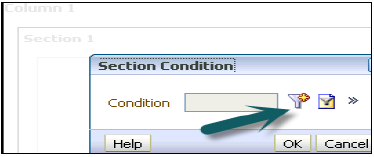
You can also test, edit or remove the condition by clicking on âmoreâ sign next to + button.
Save a Customized Dashboard
You can save your customized dashboard by going to page options → Save current customizations → Enter the name of customization → Click OK.
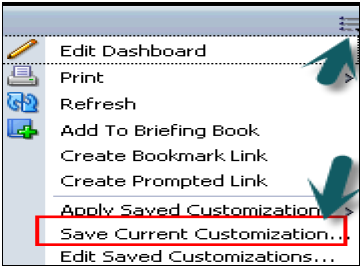
To apply customization to a dashboard page, go to page option → Apply saved customization → Select name → Click OK.
It allows you to save and view dashboard pages in their current state such as filters, prompts, column sorts, drills in analyses, and section expansion and collapse. By saving customizations, you do not need to make these choices manually each time you access the dashboard page.
Khóa học lập trình tại Toidayhoc vừa học vừa làm dự án vừa nhận lương: Khóa học lập trình nhận lương tại trung tâm Toidayhoc
Notice: Trying to access array offset on value of type bool in /home/edua/htdocs/edu.toidayhoc.com/wp-content/themes/flatsome/flatsome/inc/shortcodes/share_follow.php on line 41
