hazelcast
Khóa học miễn phí Hazelcast – Monitoring nhận dự án làm có lương
Hazelcast – Monitoring
Hazelcast provides multiple ways to monitor the cluster. We will look into how to monitor via REST API and via JMX. Let”s first look into REST API.
Monitoring Hazelcast via REST API
To monitor health of the cluster or member state via REST API, one has to enable REST API based communication to the members. This can be done by configuration and also programmatically.
Let us enable REST based monitoring via XML configuration in hazelcast-monitoring.xml −
<hazelcast
   xsi:schemaLocation="http://www.hazelcast.com/schema/config
   http://www.hazelcast.com/schema/config/hazelcast-config-3.12.12.xsd"
   xmlns="http://www.hazelcast.com/schema/config"
   xmlns:xsi="http://www.w3.org/2001/XMLSchema-instance">
   <instance-name>XML_Hazelcast_Instance</instance-name>

   <network>
      <rest-api enabled="true">
         <endpoint-group name="CLUSTER_READ" enabled="true" />
         <endpoint-group name="HEALTH_CHECK" enabled="true" />
      </rest-api>
   </network>
</hazelcast>
Let us create a Hazelcast instance which runs indefinitely in Server.java file −
public class Server {
   public static void main(String... args){
      //initialize hazelcast server/instance
      HazelcastInstance hazelcast = Hazelcast.newHazelcastInstance();
      // do not shutdown, let the server run
      //hazelcast.shutdown();
   }
}
And now let us execute start the cluster −
java ''-Dhazelcast.config=hazelcast-monitoring.xml'' -cp .targetdemo-0.0.1-
SNAPSHOT.jar com.example.demo.Server
Once started, the health of the cluster can be found out by calling the API like −
http://localhost:5701/hazelcast/health
The output of the above API call −
Hazelcast::NodeState=ACTIVE
Hazelcast::ClusterState=ACTIVE
Hazelcast::ClusterSafe=TRUE
Hazelcast::MigrationQueueSize=0
Hazelcast::ClusterSize=1
This displays that there is 1 member in our cluster and it is Active.
More detailed information about the nodes, for example, IP, port, name can be found using −
http://localhost:5701/hazelcast/rest/cluster
The output of the above API −
Members {size:1, ver:1} [
   Member [localhost]:5701 - e6afefcb-6b7c-48b3-9ccb-63b4f147d79d this
]
ConnectionCount: 1
AllConnectionCount: 2
JMX monitoring
Hazelcast also supports JMX monitoring of the data structures embedded inside it, for example, IMap, Iqueue, and so on.
To enable JMX monitoring, we first need to enable JVM based JMX agents. This can be done by passing “-Dcom.sun.management.jmxremote” to the JVM. For using different ports or use authentication, we can use -Dcom.sun.management.jmxremote.port, – Dcom.sun.management.jmxremote.authenticate, respectively.
Apart from this, we have to enable JMX for Hazelcast MBeans. Let us enable JMX based monitoring via XML configuration in hazelcast-monitoring.xml −
<hazelcast
   xsi:schemaLocation="http://www.hazelcast.com/schema/config
   http://www.hazelcast.com/schema/config/hazelcast-config-3.12.12.xsd"
   xmlns="http://www.hazelcast.com/schema/config"
   xmlns:xsi="http://www.w3.org/2001/XMLSchema-instance">
   <instance-name>XML_Hazelcast_Instance</instance-name>

   <properties>
      <property name="hazelcast.jmx">true</property>
   </properties>
</hazelcast>
Let us create a Hazelcast instance which runs indefinitely in Server.java file and add a map −
class Server {
   public static void main(String... args){
      //initialize hazelcast server/instance
      HazelcastInstance hazelcast = Hazelcast.newHazelcastInstance();
      //create a simple map
      Map<String, String> vehicleOwners = hazelcast.getMap("vehicleOwnerMap");
      // add key-value to map
      vehicleOwners.put("John", "Honda-9235");
      // do not shutdown, let the server run
      //hazelcast.shutdown();
   }
}
Now we can execute the following command to enable JMX −
java ''-Dcom.sun.management.jmxremote'' ''-Dhazelcast.config=othershazelcastmonitoring.
xml'' -cp .targetdemo-0.0.1-SNAPSHOT.jar com.example.demo.Server
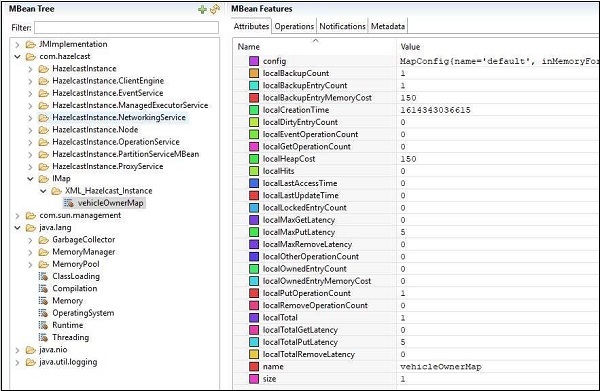
The JMX ports can now be connected by JMX clients like jConsole, VisualVM, etc.
Here is a snapshot of what we will get if we connect using jConsole and see the attributes for VehicleMap. As we can see, the name of the map as vehicleOwnerMap and the size of map being 1.

Khóa học lập trình tại Toidayhoc vừa học vừa làm dự án vừa nhận lương: Khóa học lập trình nhận lương tại trung tâm Toidayhoc
Notice: Trying to access array offset on value of type bool in /home/edua/htdocs/edu.toidayhoc.com/wp-content/themes/flatsome/flatsome/inc/shortcodes/share_follow.php on line 41
